PA Residential Building
1. Project Description
The current study numerically reproduces a wind tunnel assessment of high-rise building with urban surroundings. The project was measured in a wind tunnel facility. The time histories of forces-by-floor were provided to us, and serve as a basis for comparison
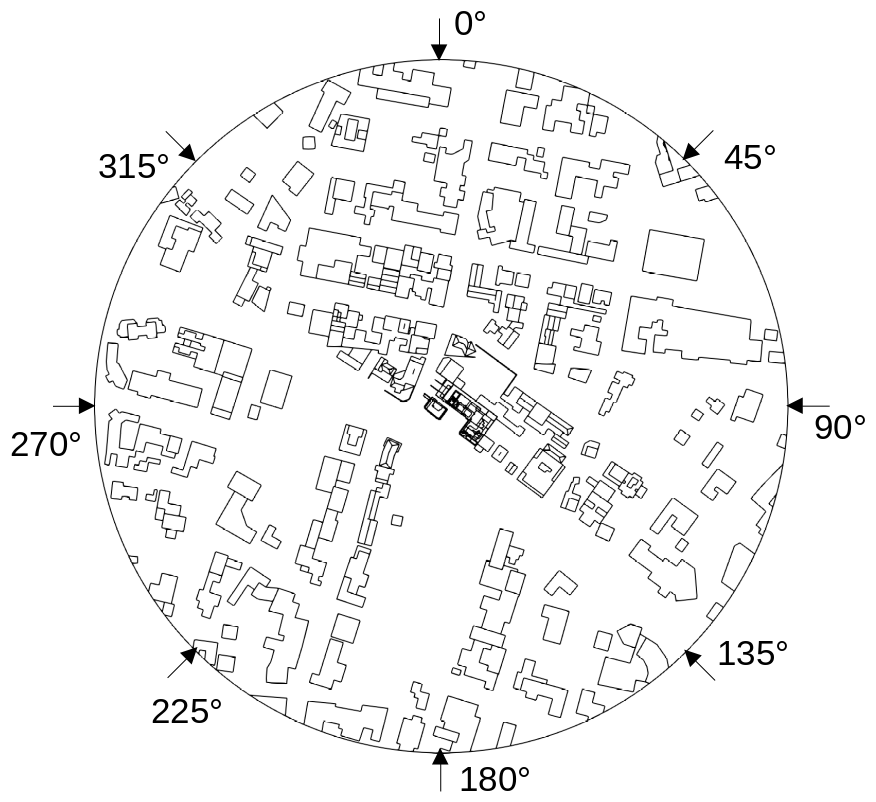
The horizontal reference width of the main building is \(B=45.6\mathrm{m}\) and its geometry is shown below:

The wind directions chosen to be simulated were:
Wind direction |
0 \(^\circ\) |
40 \(^\circ\) |
90 \(^\circ\) |
130 \(^\circ\) |
180 \(^\circ\) |
220 \(^\circ\) |
270 \(^\circ\) |
310 \(^\circ\) |
With the coordinate system
2. Simulation Setup
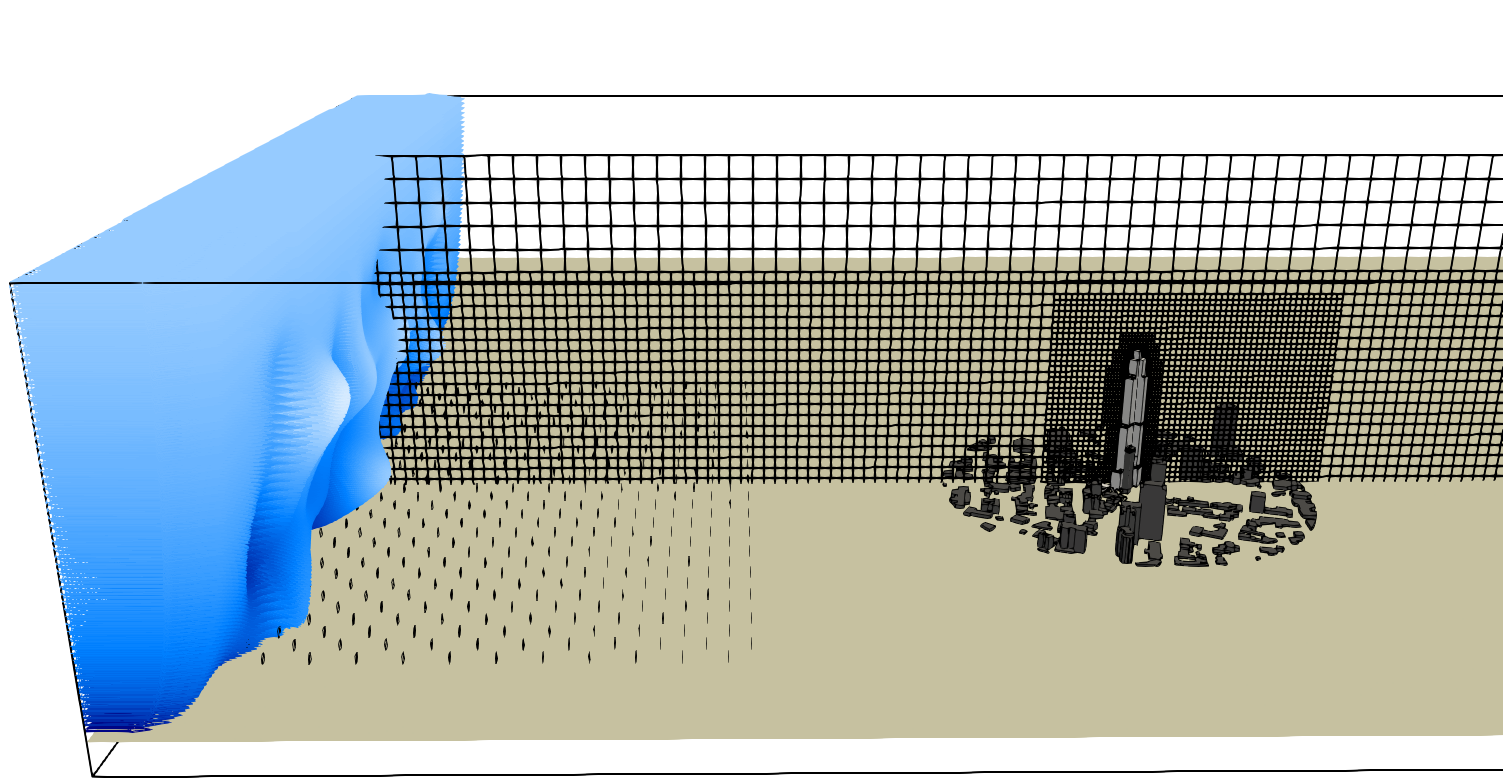
The Synthetic Eddy Method (SEM) boundary condition is applied at the inlet of the computational domain. Solid fins are distributed across the floor to ensure the desired velocity and turbulence profiles at the test section. A Neumann boundary condition is applied at the remaining boundaries.
The building is positioned \(6H\) from inlet, and 6 grid refinement levels (\(lvl\,0\) to \(lvl\,5\)) were adopted:

A 1:2 refinement ratio is estabilished between levels, and the simulation parameters at the building level were:
\(\boldsymbol{\Delta x/B}\) (spatial resolution) |
6.85e-03 |
\(\boldsymbol{\Delta t/CTS}\) (temporal resolution) |
4.53e-04 |
exports/\(\boldsymbol{CTS}\) (pressure acquisition frequency) |
1.00e+01 |
\(\boldsymbol{T/CTS}\) (statistical sample size) |
1.04e+03 |
\(\boldsymbol{Re_{B}=U_{H}H/\nu}\) |
7.48e+04 |
The equivalent parameters in full-scale are:
\(\boldsymbol{\Delta x[m]}\) |
0.31 |
\(\boldsymbol{\Delta t[ms]}\) |
0.45 |
\(\boldsymbol{f[Hz]}\) |
9.98 |
\(\boldsymbol{T[s]}\) |
1046.56 |
The computational resources required were:
Device |
Wind direction |
Node count (million) |
Allocated memory (Gb) |
Ellapsed time (h) |
NVIDIA A10G |
0 \(^\circ\) |
122.02 |
14.76 |
94.18 |
NVIDIA A10G |
40 \(^\circ\) |
127.84 |
15.41 |
93.26 |
NVIDIA A10G |
90 \(^\circ\) |
119.29 |
14.45 |
89.08 |
NVIDIA A10G |
130 \(^\circ\) |
127.80 |
15.41 |
88.01 |
NVIDIA A10G |
180 \(^\circ\) |
122.02 |
14.75 |
86.53 |
NVIDIA A10G |
220 \(^\circ\) |
128.41 |
15.47 |
85.47 |
NVIDIA A10G |
270 \(^\circ\) |
120.79 |
14.61 |
94.32 |
NVIDIA A10G |
310 \(^\circ\) |
128.37 |
15.46 |
91.80 |
3. Inflow
An empty domain simulation is performed to measure the mean velocity and turbulence profiles. A probe line is placed at the position where the building will be located. The mean velocities used for calculating the pressure coefficient and convective time scale are taken from this simulation.
Wind Profiles

Wind Spectra
The power spectral density of the velocity components at height \(H\) are compared with theoretical Von Kármán curves to validate the atmospheric flow.

4. Results: Global Statistics
The wind effect on the solid building is measured through force and moment coefficients. The building is divided in 76 floors. The force coefficient is calculated as:
where \(A_{i}\) is the tributary area.
For the peak values, the following procedure was applied for both datasets (numerical experimental):
The sample is subdivided in sub-samples of duration \(T\), and a 3s moving-average is applied to all sub-samples.
The smoothed sub-samples are divided in 10 intervals, from which the minimum and maximum values are taken.
The max/min values are fitted into a Gumbel distribution, and the mode \(U\) is rescaled to a duration of 1h.
A non-excedence probability of 78% is considered for the extreme values.
Force Coefficient - Mean and Peak


Force Coefficient - RMS


Force Coefficient - Spectrum


Execution Notes
Execution Date (YYYY-MM-DD) |
2025-3-7 |
Solver Version |
1.6.18 |
Changelog
19 Dez 2024: Added case