
 AeroSim Docs
Force Coefficient
The Force Coefficient, \(C_f\), is a dimensionless parameter that provides a generalized representation of the resultant forces experienced by an object within a fluid flow. It offers a means to evaluate the cumulative effect of pressure coefficients, \(c_p\) across different regions of an object’s surface and how these pressures translate into aerodynamic forces.
\(C_f\) is a fundamental tool for assessing lift, drag, and other forces crucial for the design and analysis of aerodynamic components.
Definition
This coefficient is defined as a net resulting force coefficient of a body. A body is composed by a set of surfaces. For example, consider a building’s canopy, where the lower surface is marked on red, and the upper surface is marked on green:
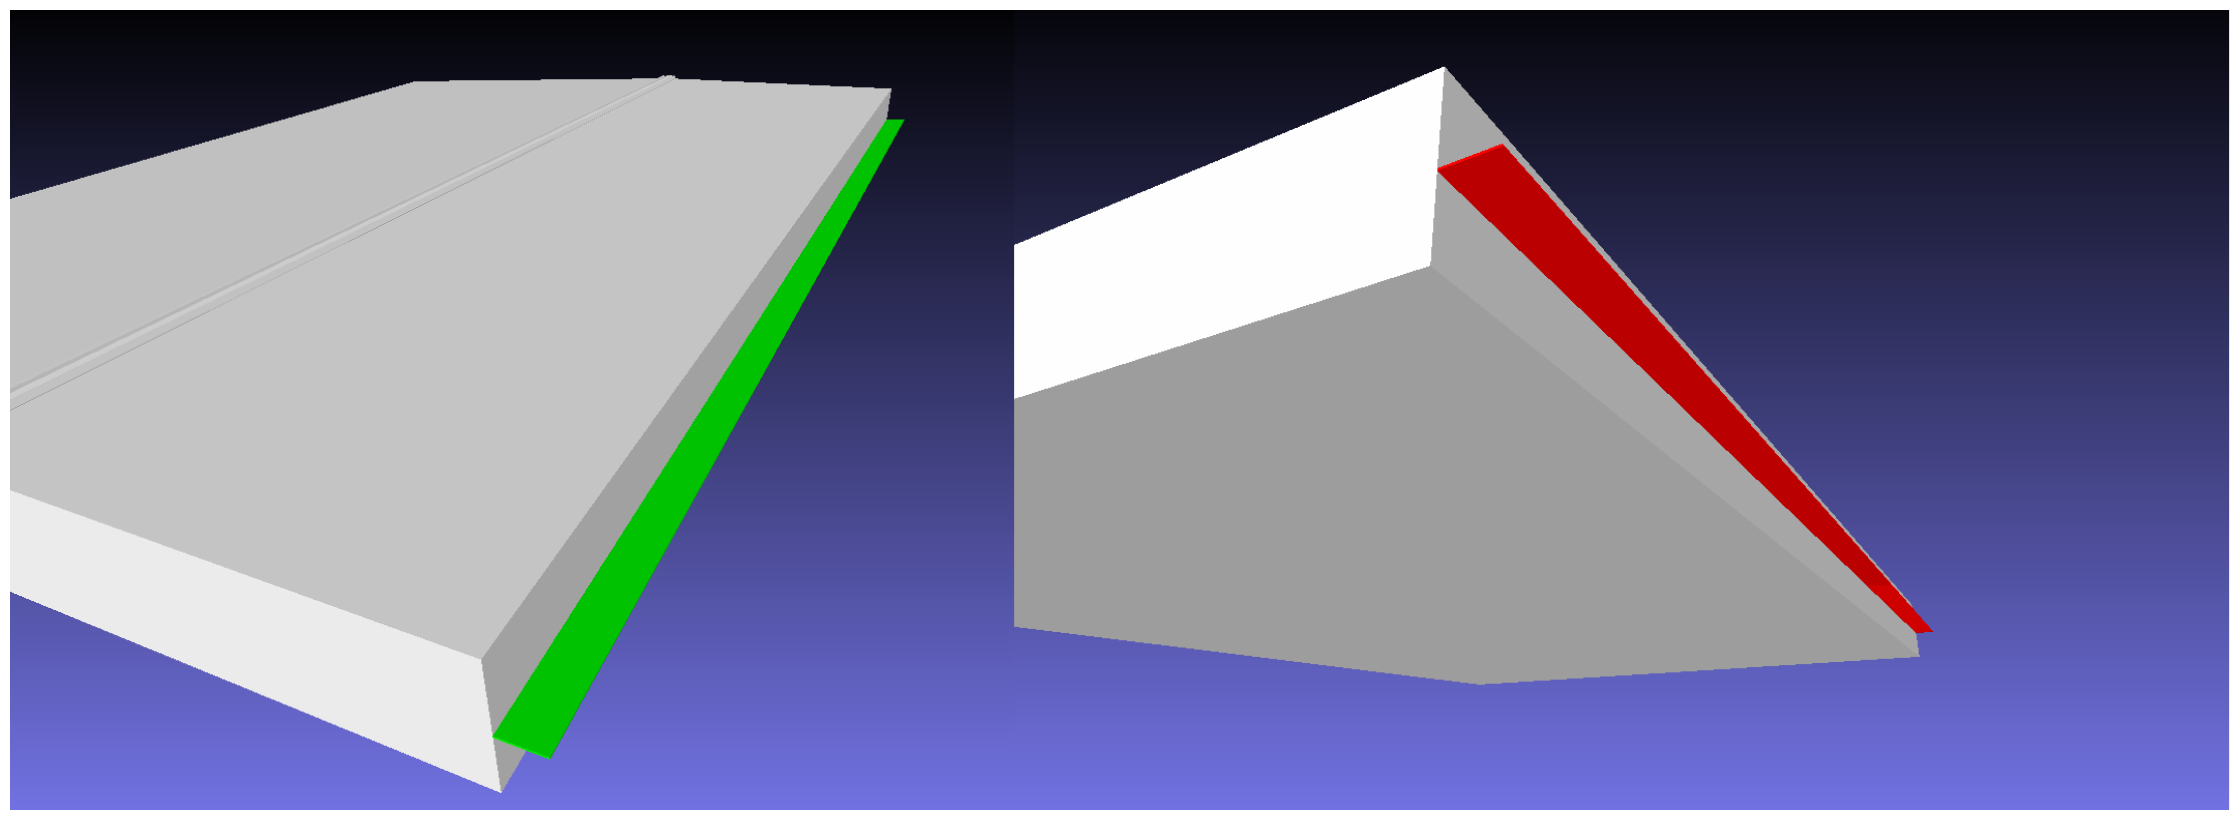
The net resulting force coefficient is defined as:
Important
Note that the net force coefficient has a direction attached to its definition. Its direction is the same as the resulting force direction.
It can also be defined for each axis direction:
We define the nominal area (\(A_x\), \(A_y\), \(A_z\)) as a user input, constant for all axis (\(A_x\)=\(A_y\)=\(A_z\)). This is done to let the user define how they want to calculate its value. The mathematical definition is to use the projection of the surface area for the body composed in the given axis.
Note
For a non constant nominal area, the values of moment coefficient can be generated and later renormalized based on geometry informations.
Use Case
A common application of the net force coefficient requires sectioning the body in different sub-bodies. To do so, a similar logic applied to the shape coefficient is used to determine the respective sub-body of each of the body’s triangles. If its center lies inside the sub-body volume, then it belongs to it.
The result is a sectionated body in different sub-bodies for each interval. When sectioning the body, the respective nominal area should be the same as the sub-body nominal area.
Note
Check out the concepts section for more information about surface, body and sub-body definitions.
Like the other coefficients, we can apply statistical analysis to the net force coefficient.
By definition, the net force coefficient is a property of a body.
It is used for primary and secondary structures design, such as canopies and roof vents. It can also be used for evaluating the resultant wind action over a building or the building paviments. It can be seen as the resulting effect of the wind induced force over a body.
Artifacts
The Cf template reads a Cp time series (kind: surface, produced by
the Cp template) and composes:
mesh_attach– pull per-triangle areas, normals and centroids from the.lnas(or.h5) mesh.body_grouping– assign each triangle to a body. An empty surface list (building: []) selects every surface in the mesh, so a single-surface mesh becomes one body.force_contribution– per-trianglecf_x/cf_y/cf_zfrom Cp, areas and normals, scaled by the nominal area.field_series_for_groups– sum each direction over each body.
The output is one GroupsDataSource per direction (cf_x / cf_y /
cf_z) with one row per body, writable to an XDMF+H5 pair.
Usage
Run the shipped template:
cfdmod run fixtures/tests/pressure/templates/cf.yaml
or from Python:
from cfdmod import load_template, run_template, XdmfH5Storage

bindings = run_template(load_template("cf.yaml"), storage=XdmfH5Storage(root="."))
cf_x = bindings["cf_x"]          # GroupsDataSource, one row per body
The calculate_Cf.ipynb notebook walks through this
template; a worked example covering Cp, Cf, Cm and Ce together lives at
examples/container_pack/process_container_pack.ipynb in the repository.
Data format
Note
The rule for determining the region_idx is based on the region index and the body name. Input mesh can have multiple bodies, and each of them can be applied a specific zoning/region rule. Because of that, region_idx has to be composed by the zoning region index joined by “-” and the body name. This also guarantee that even if different bodies lie on the same region, the interpreted region for each of them will be different
Note
For more information about the normalized time scale (\(t^*\)), check the Time Normalization section
time_idx/region_idx |
Normalized time (\(t^*\)) |
0-Body1 |
1-Body1 |
0-Body2 |
|---|---|---|---|---|
0 |
10000 |
1.25 |
1.15 |
-1.1 |
1 |
11000 |
1.5 |
0.9 |
-1.15 |
time_idx/region_idx |
Normalized time (\(t^*\)) |
0-Body1 |
1-Body1 |
0-Body2 |
|---|---|---|---|---|
0 |
10000 |
1.25 |
1.15 |
-1.1 |
1 |
11000 |
1.5 |
0.9 |
-1.15 |
time_idx/region_idx |
Normalized time (\(t^*\)) |
0-Body1 |
1-Body1 |
0-Body2 |
|---|---|---|---|---|
0 |
10000 |
1.25 |
1.15 |
-1.1 |
1 |
11000 |
1.5 |
0.9 |
-1.15 |
region_idx |
max |
min |
mean |
std |
skewness |
kurtosis |
|---|---|---|---|---|---|---|
0-Body1 |
1.25 |
0.9 |
1.1 |
0.2 |
0.1 |
0.15 |
1-Body1 |
1.15 |
0.95 |
1.13 |
0.19 |
0.11 |
0.13 |
region_idx |
max |
min |
mean |
std |
skewness |
kurtosis |
|---|---|---|---|---|---|---|
0-Body1 |
1.25 |
0.9 |
1.1 |
0.2 |
0.1 |
0.15 |
1-Body1 |
1.15 |
0.95 |
1.13 |
0.19 |
0.11 |
0.13 |
region_idx |
max |
min |
mean |
std |
skewness |
kurtosis |
|---|---|---|---|---|---|---|
0-Body1 |
1.25 |
0.9 |
1.1 |
0.2 |
0.1 |
0.15 |
1-Body1 |
1.15 |
0.95 |
1.13 |
0.19 |
0.11 |
0.13 |
region_idx |
point_idx |
|---|---|
0-Body1 |
0 |
1-Body1 |
1 |
region_idx |
x_min |
x_max |
y_min |
y_max |
z_min |
z_max |
Lx |
Ly |
Lz |
|---|---|---|---|---|---|---|---|---|---|
0-Body1 |
0 |
100 |
0 |
50 |
0 |
20 |
0.5 |
0.8 |
0.1 |
1-Body1 |
100 |
200 |
0 |
50 |
0 |
20 |
0.8 |
0.5 |
0.2 |