Visualizing Your First Results
Once a run completes, open the Results item in the run panel to access all available outputs.
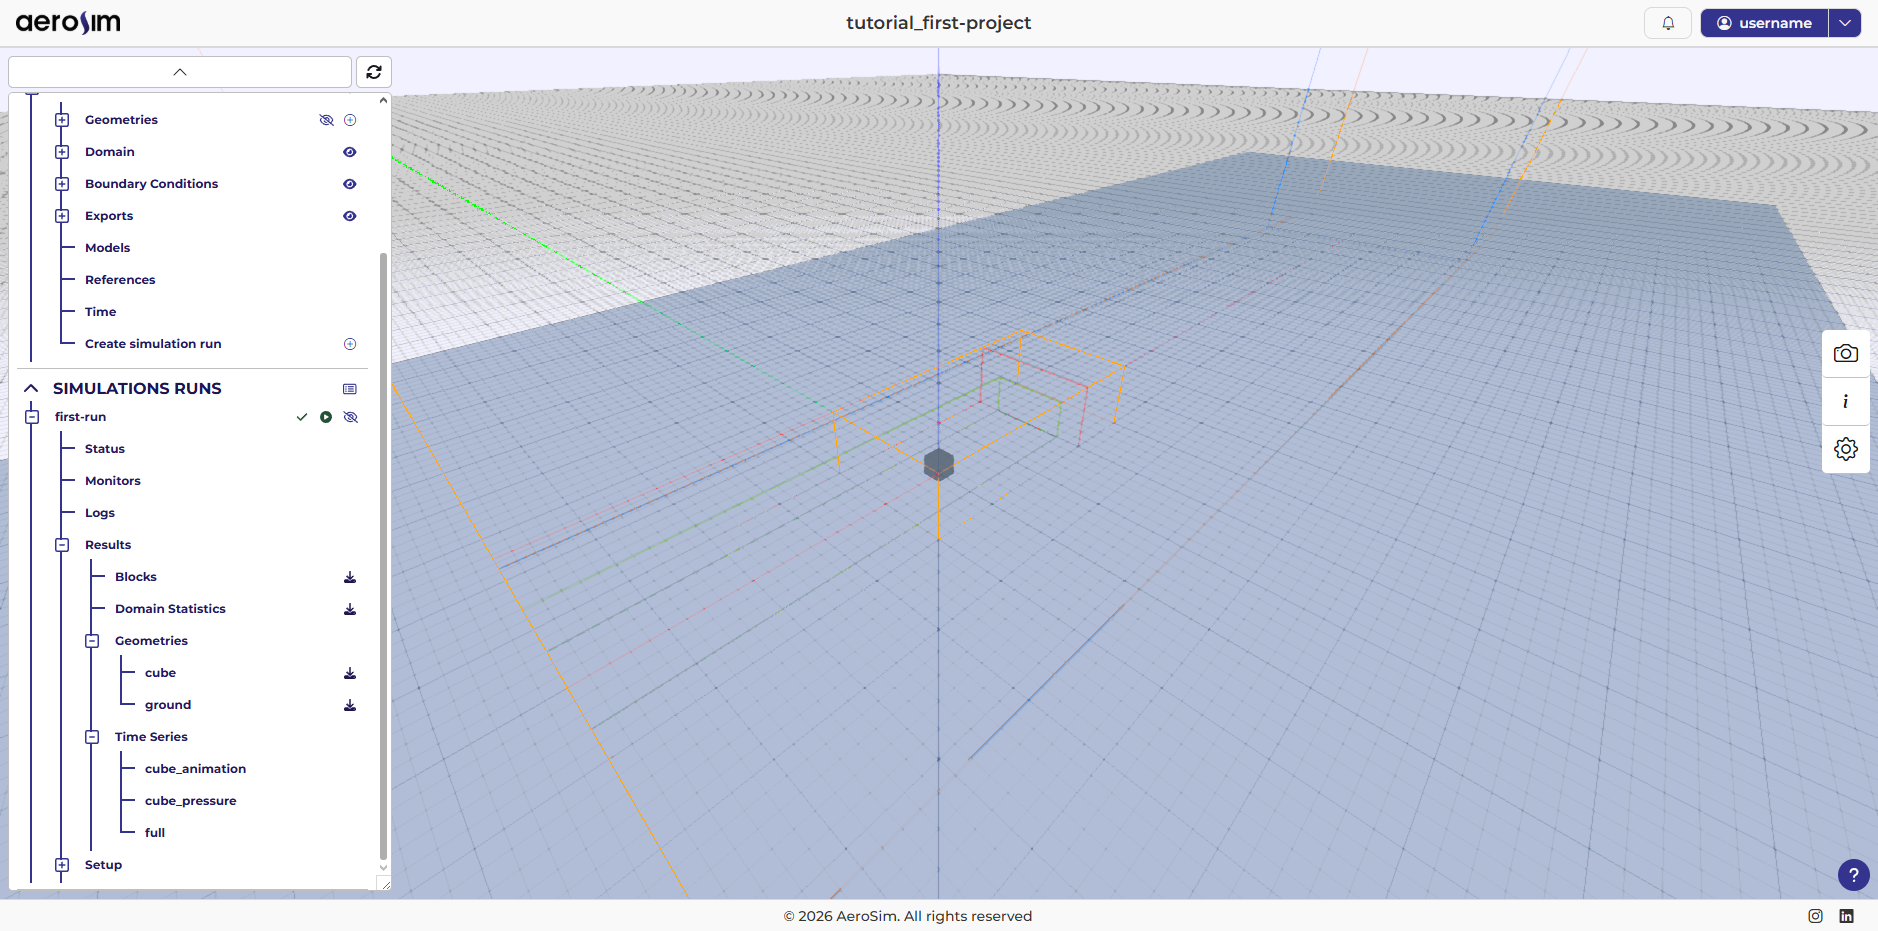
Results panel for a completed run.
Note
For post-processing, we recommend ParaView, a well-established platform for scientific and engineering visualization. Download and install it before proceeding.
Results tree
The Results panel lists all files and artifacts available for the run. From this panel you can download all results and artifacts.
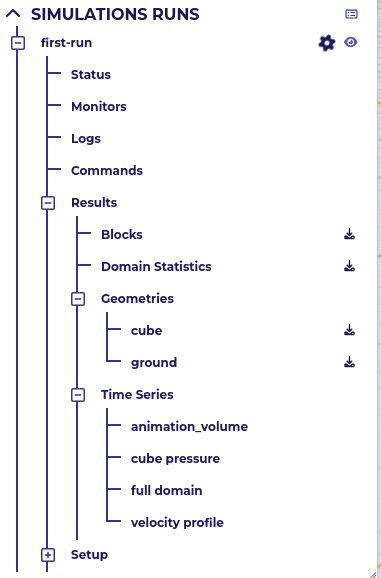
Results tree.
The primary outputs - Full Domain, Animation Export, Domain Statistics, Cube Pressure, and Velocity Profile - are covered first. Utility items (Blocks and Geometries) are described at the end.
Data
For volumetric data, for example, the .xdmf or .h5 file containing data can be downloaded and opened in ParaView.
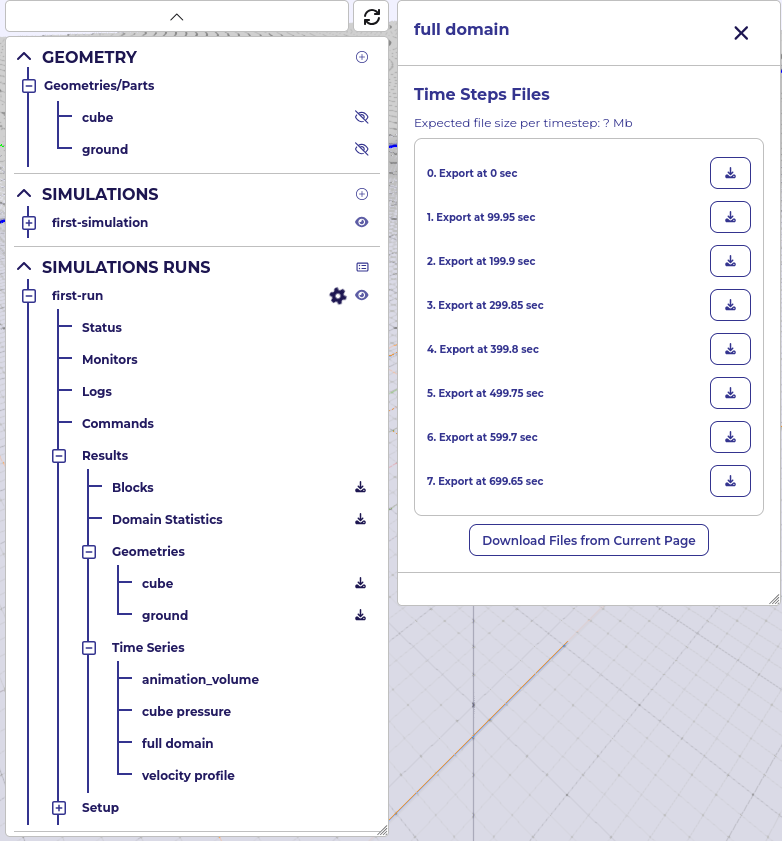
Full Domain download form.
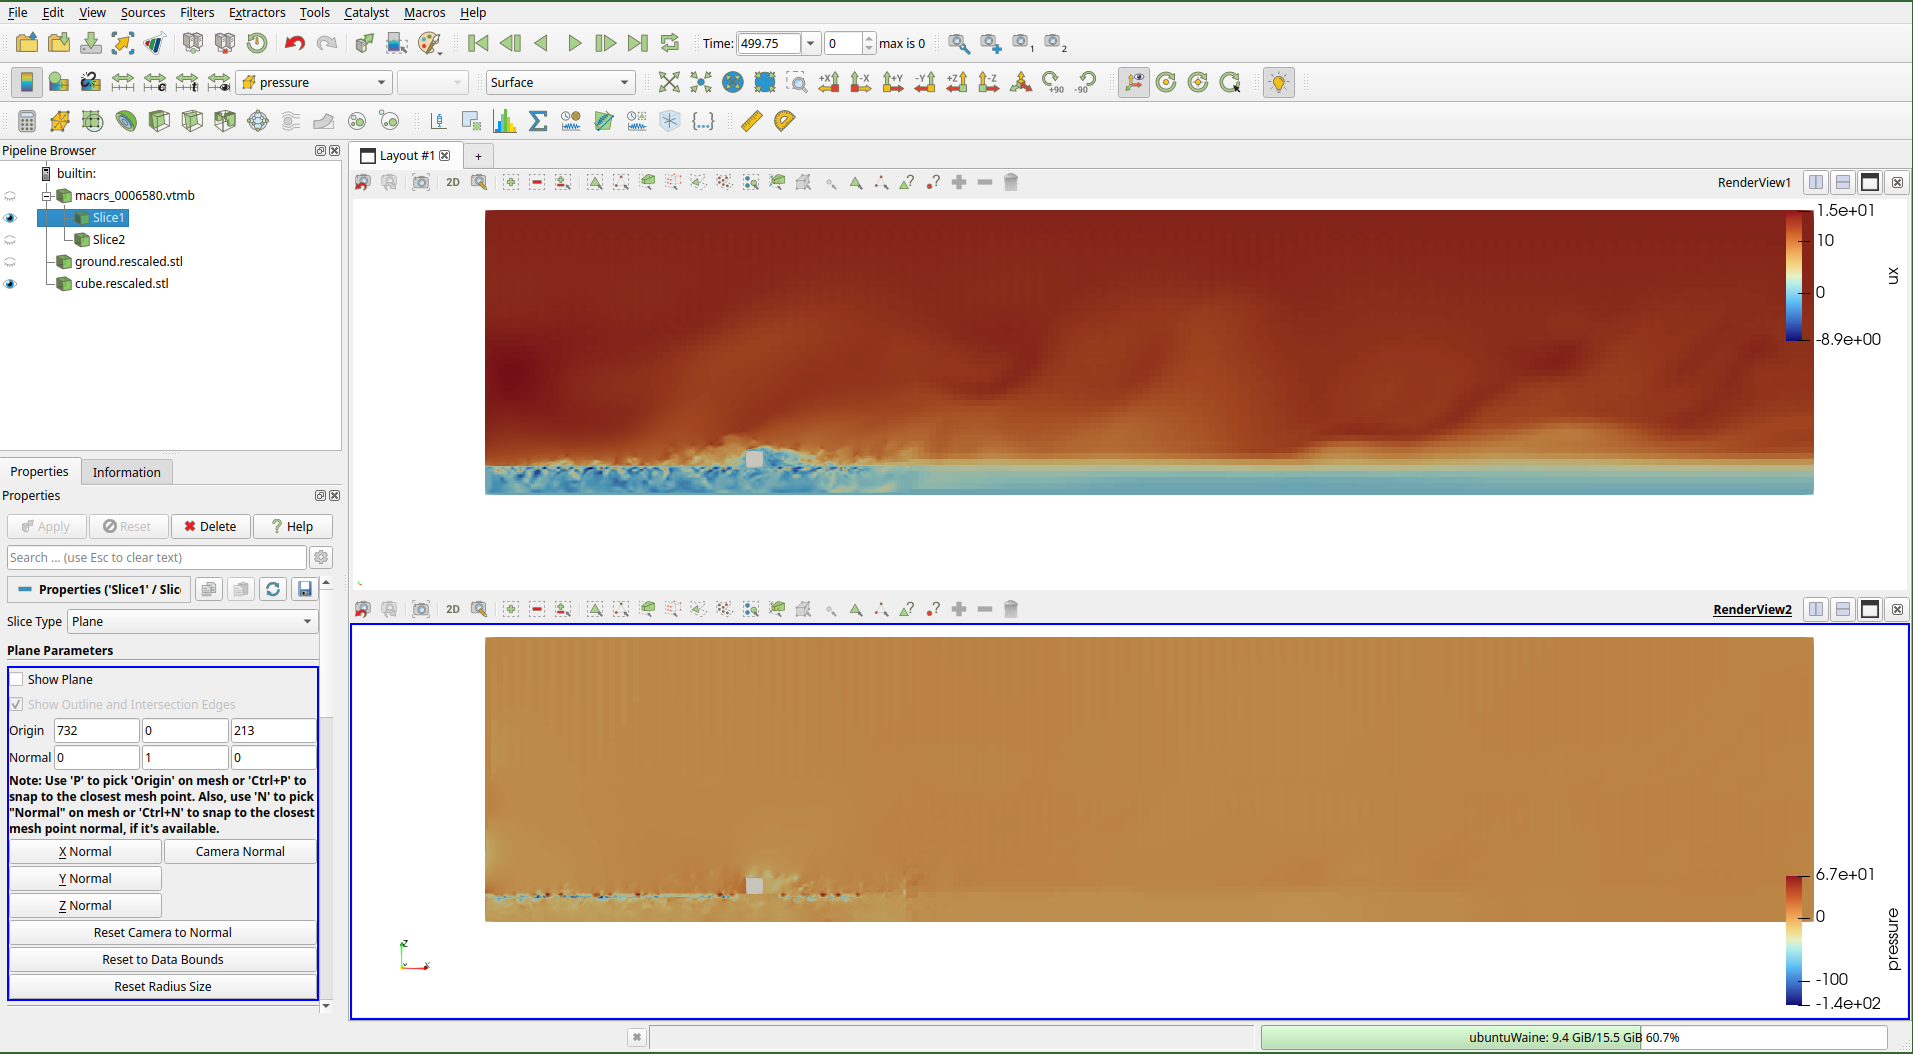
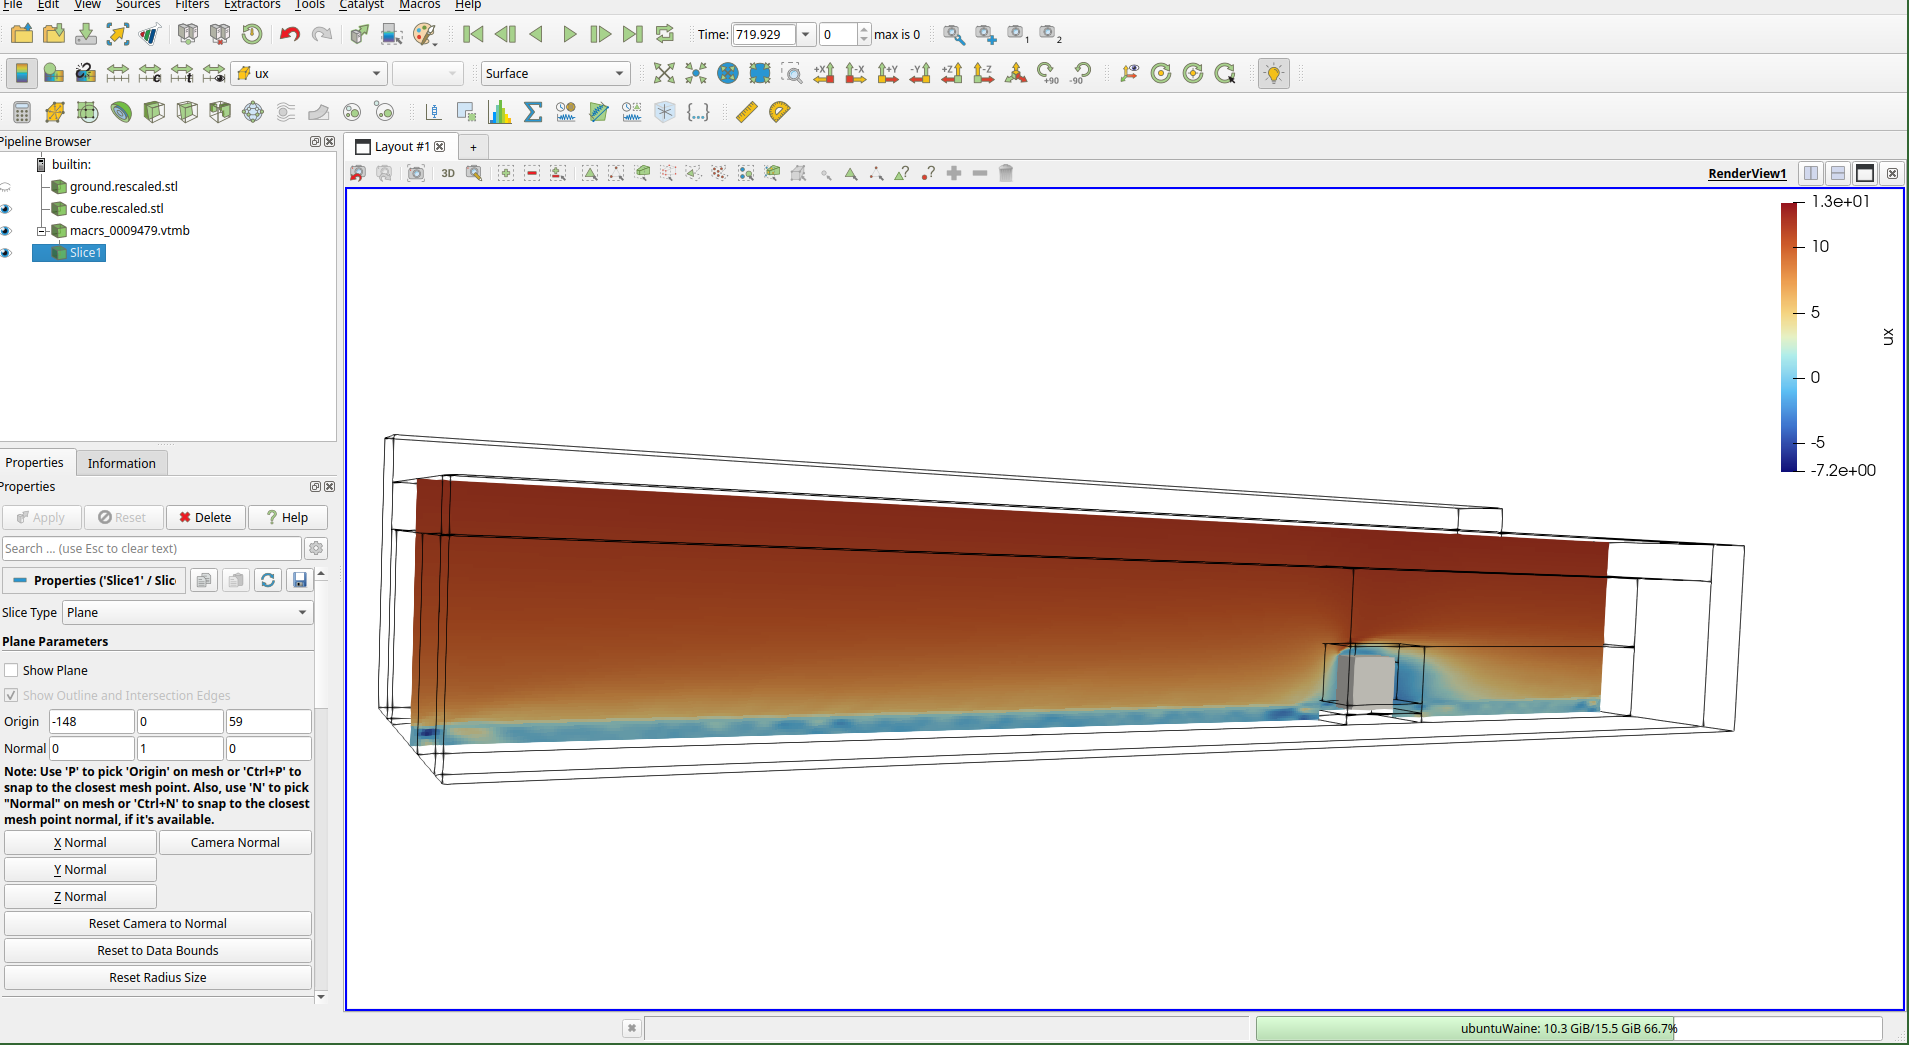
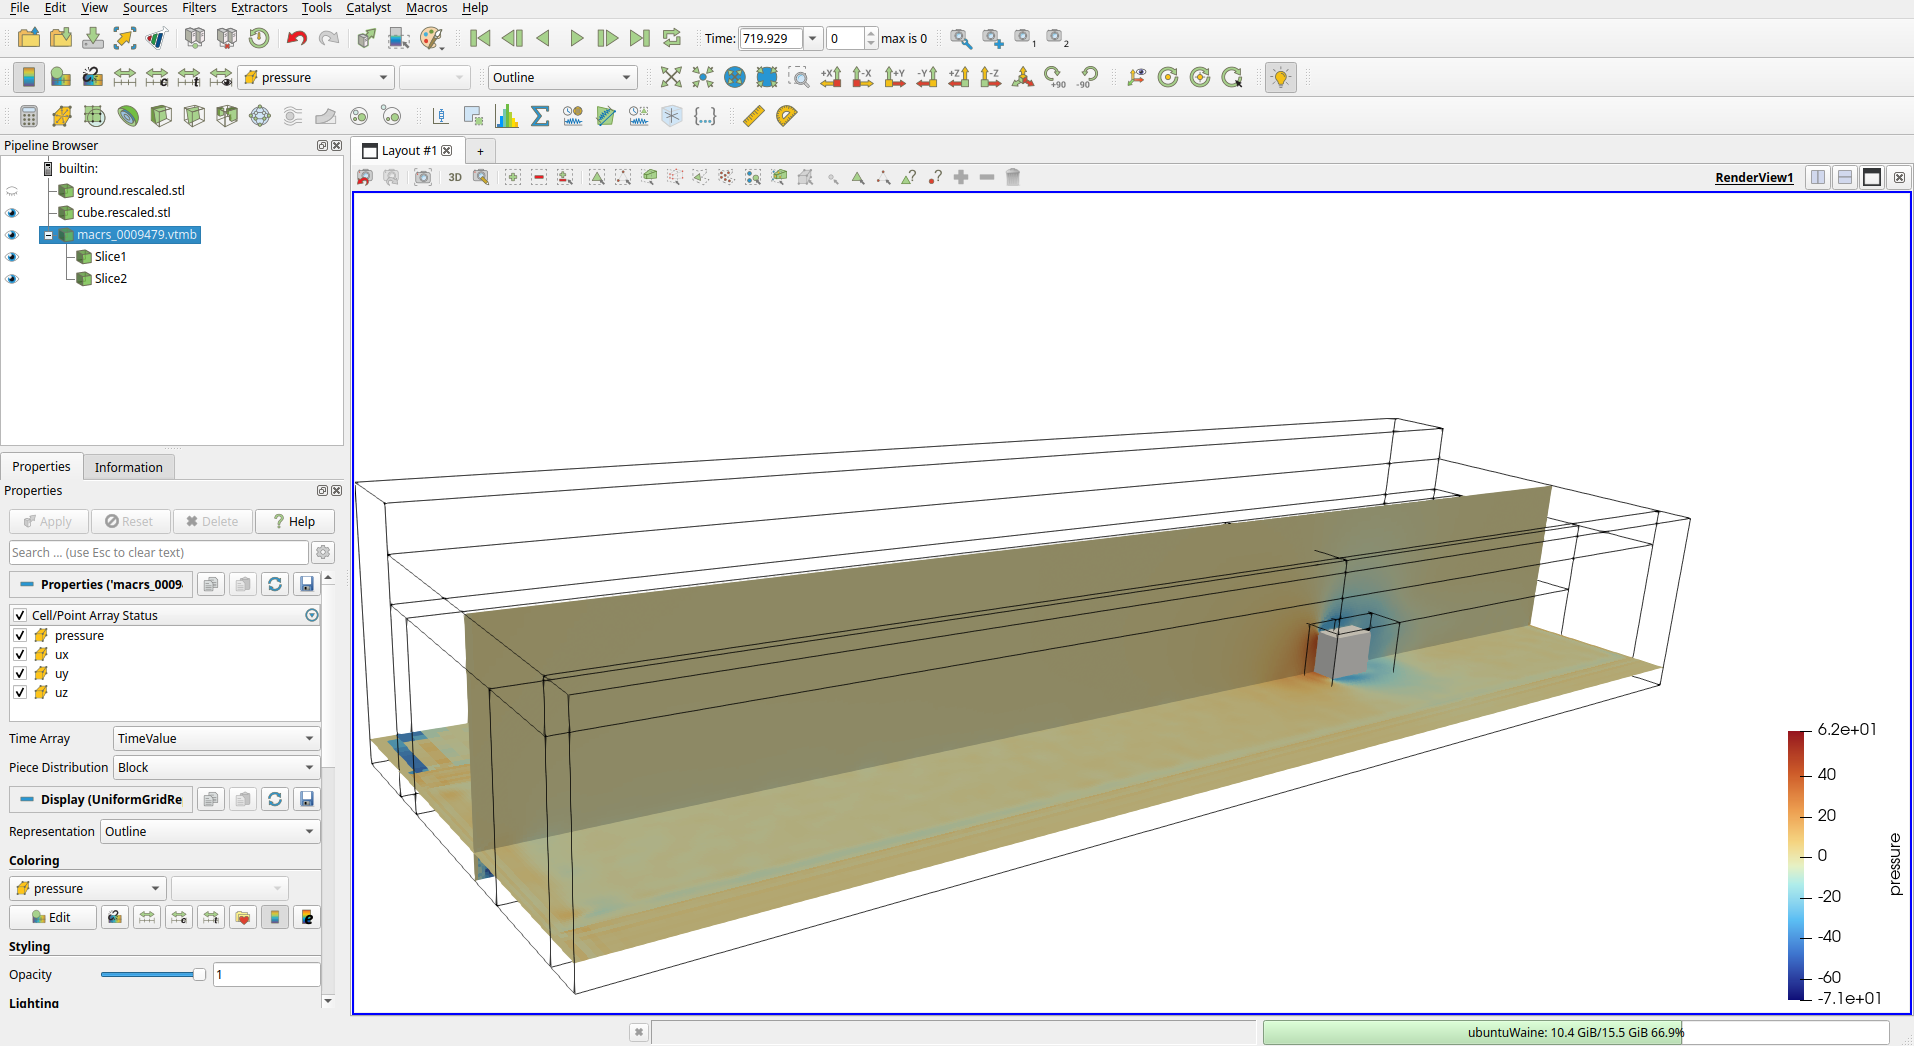
In ParaView, use slices, clips, and other filters to inspect the flow at any location and orientation. This is useful to debug the simulation and check for inconsistencies or unexpected numerical behavior.
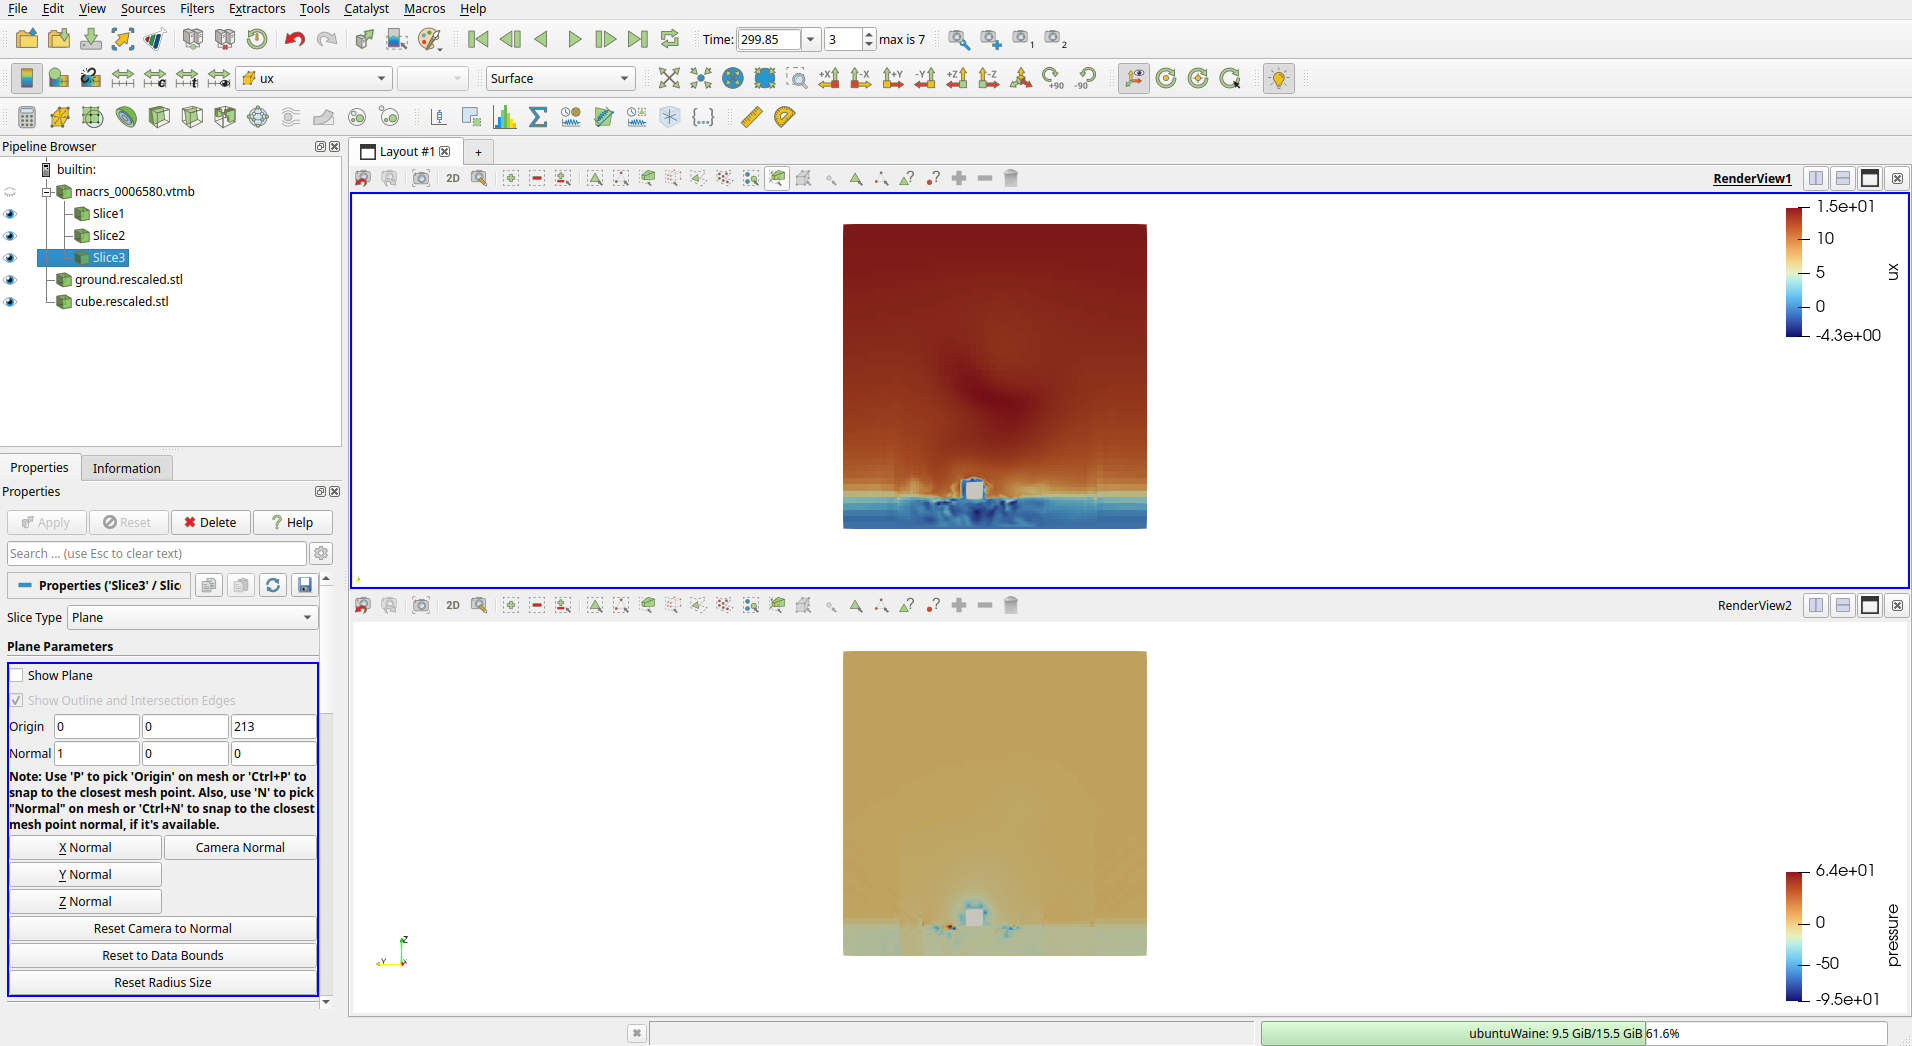
Slice in x: velocity (top) and pressure (bottom).
Slice in y: velocity (top) and pressure (bottom).
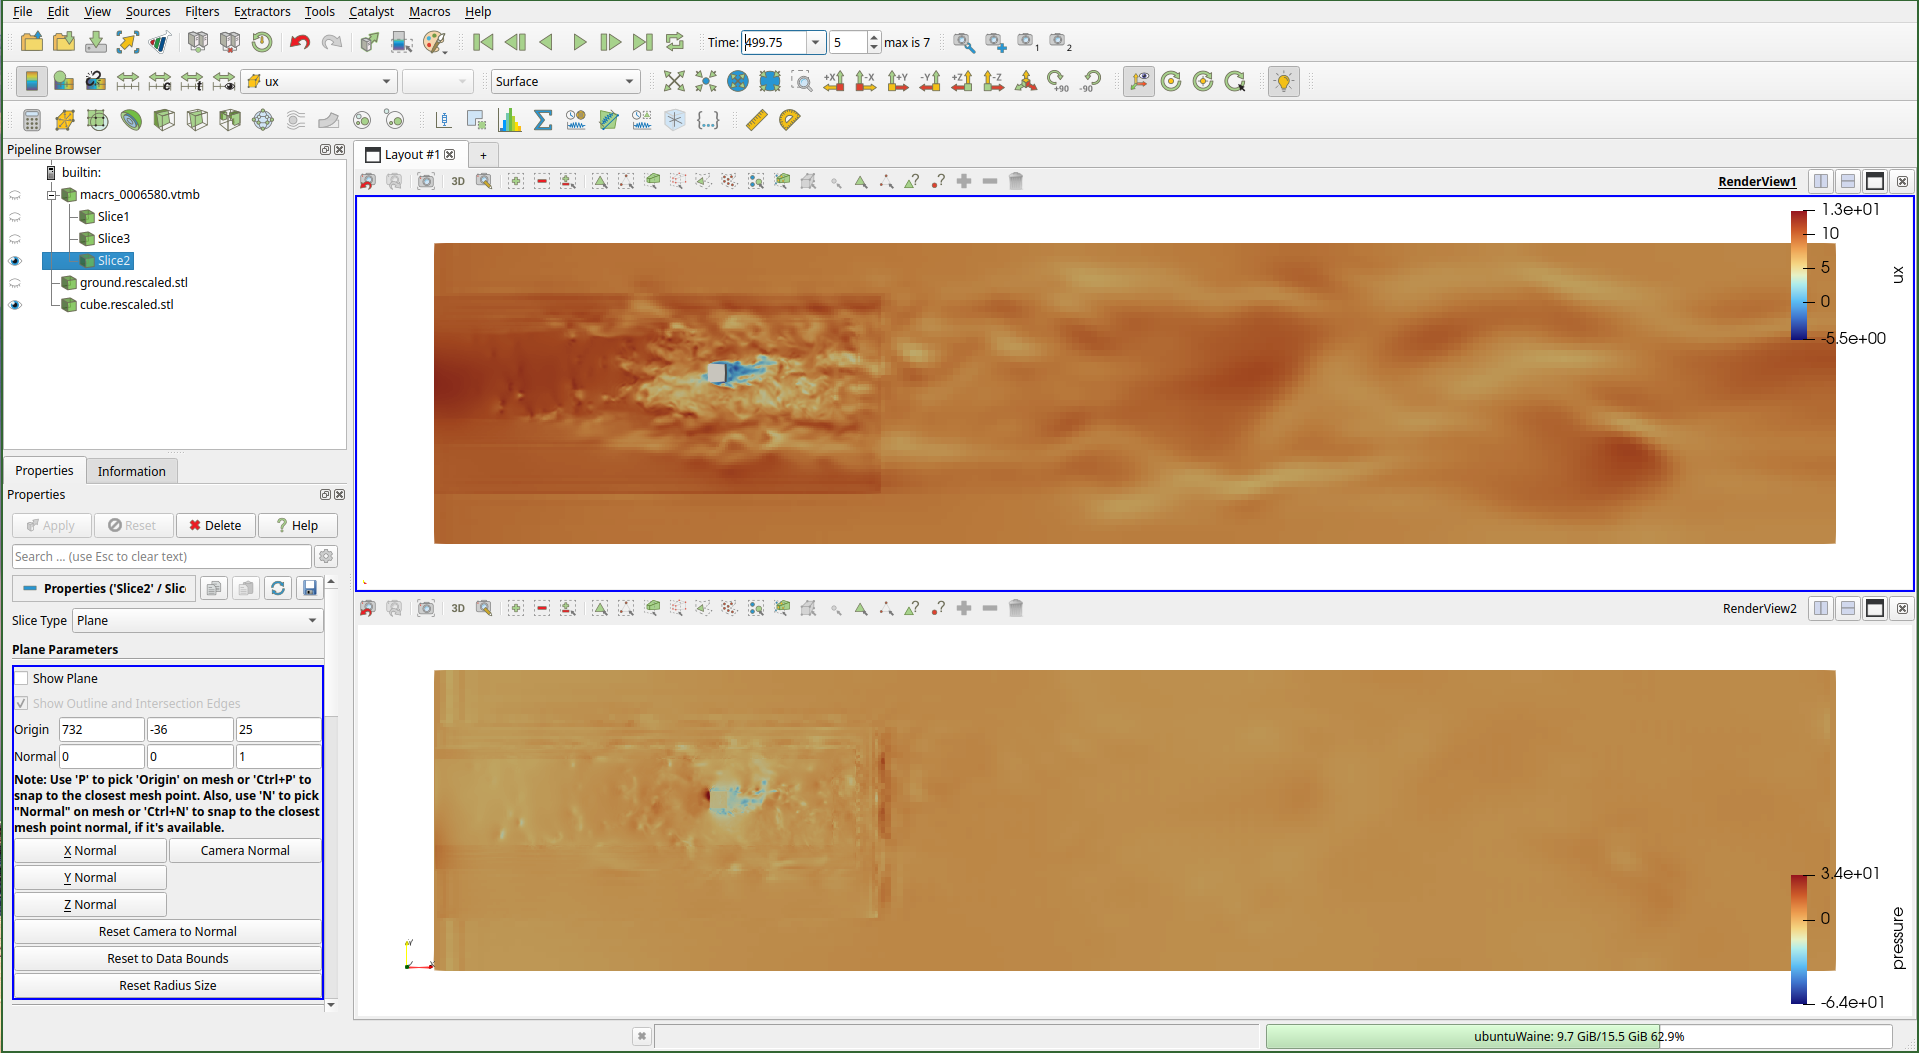
Slice in z: velocity (top) and pressure (bottom).
Animation Export
For animations, the same download logic as Full Domain applies. Because many time steps are involved, download all files from each page in turn, extract them all into a single folder, and open the sequence in ParaView. Both this and the Full Domain output use the same VTK format - the difference is in the volume and sampling period configured for each export in the simulation settings.
Note
Download the geometries from the results and open them in ParaView as well, to improve representation.
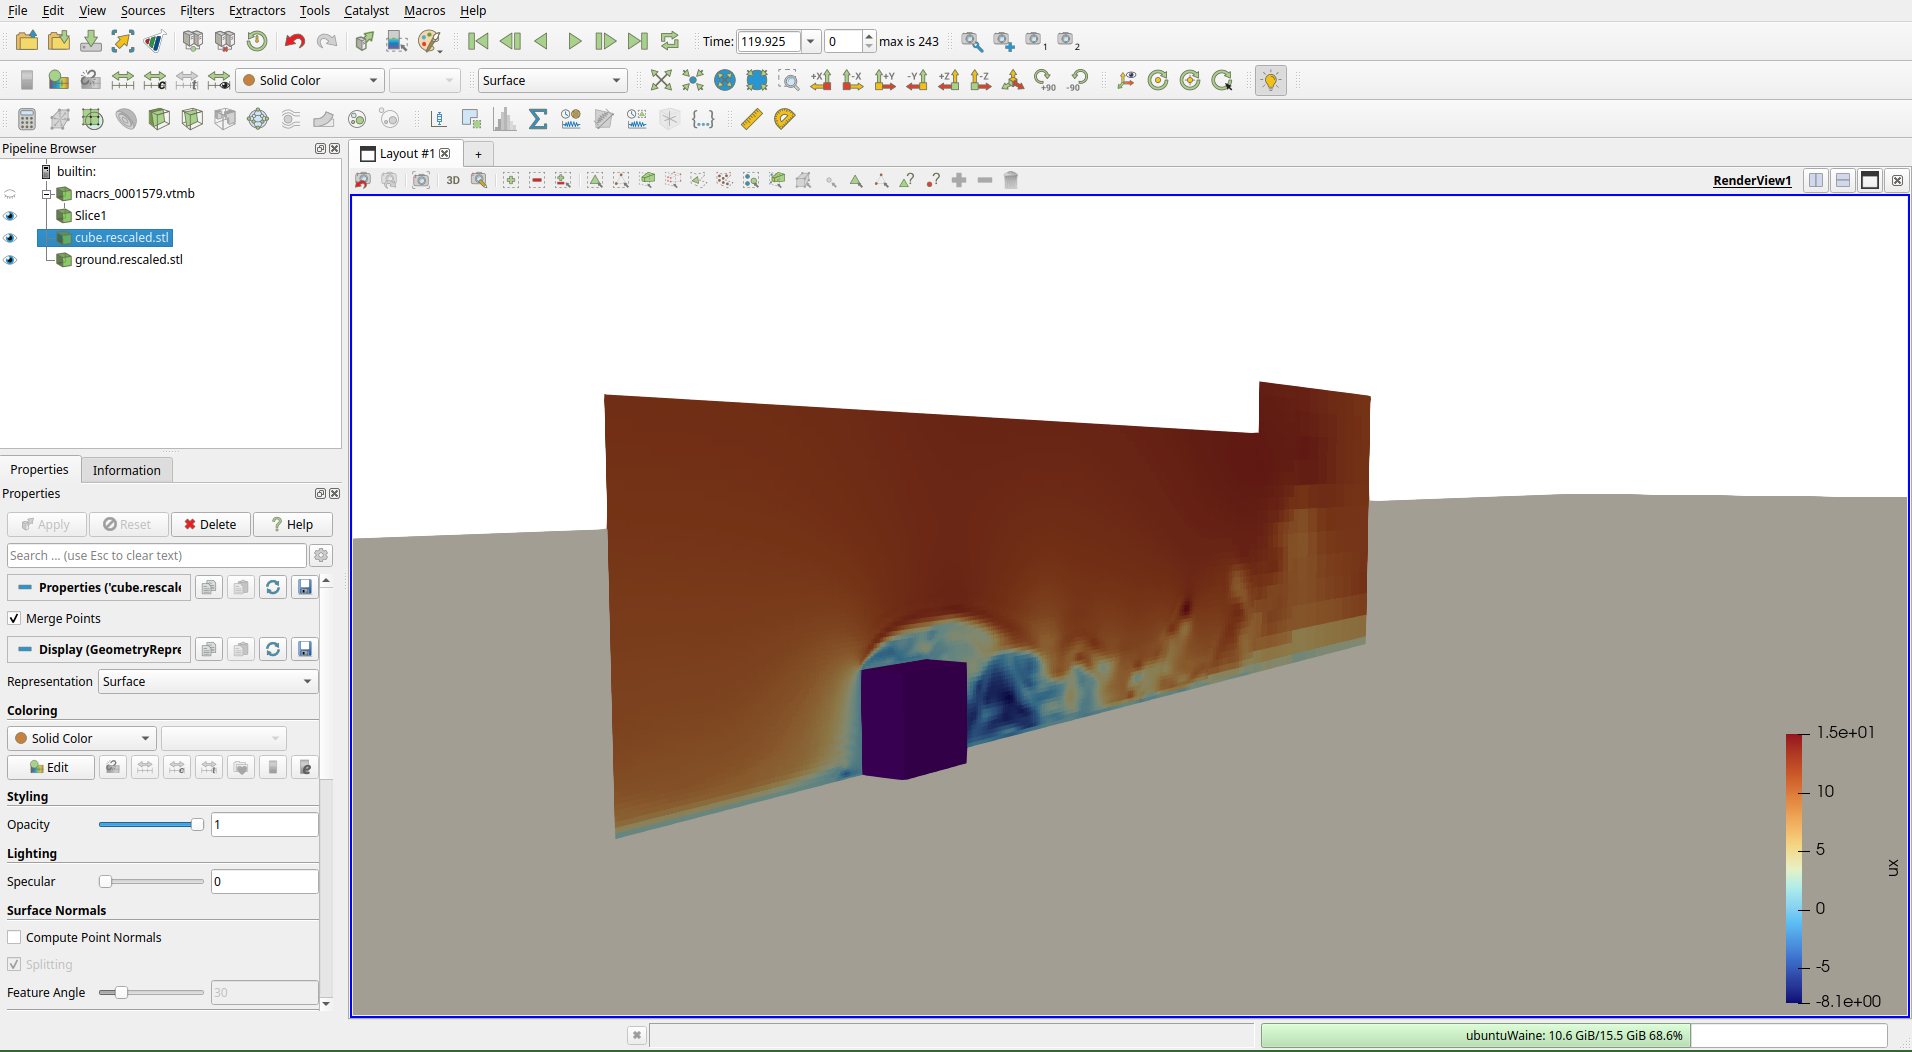
Velocity slice loaded from exported VTK sequence in ParaView.
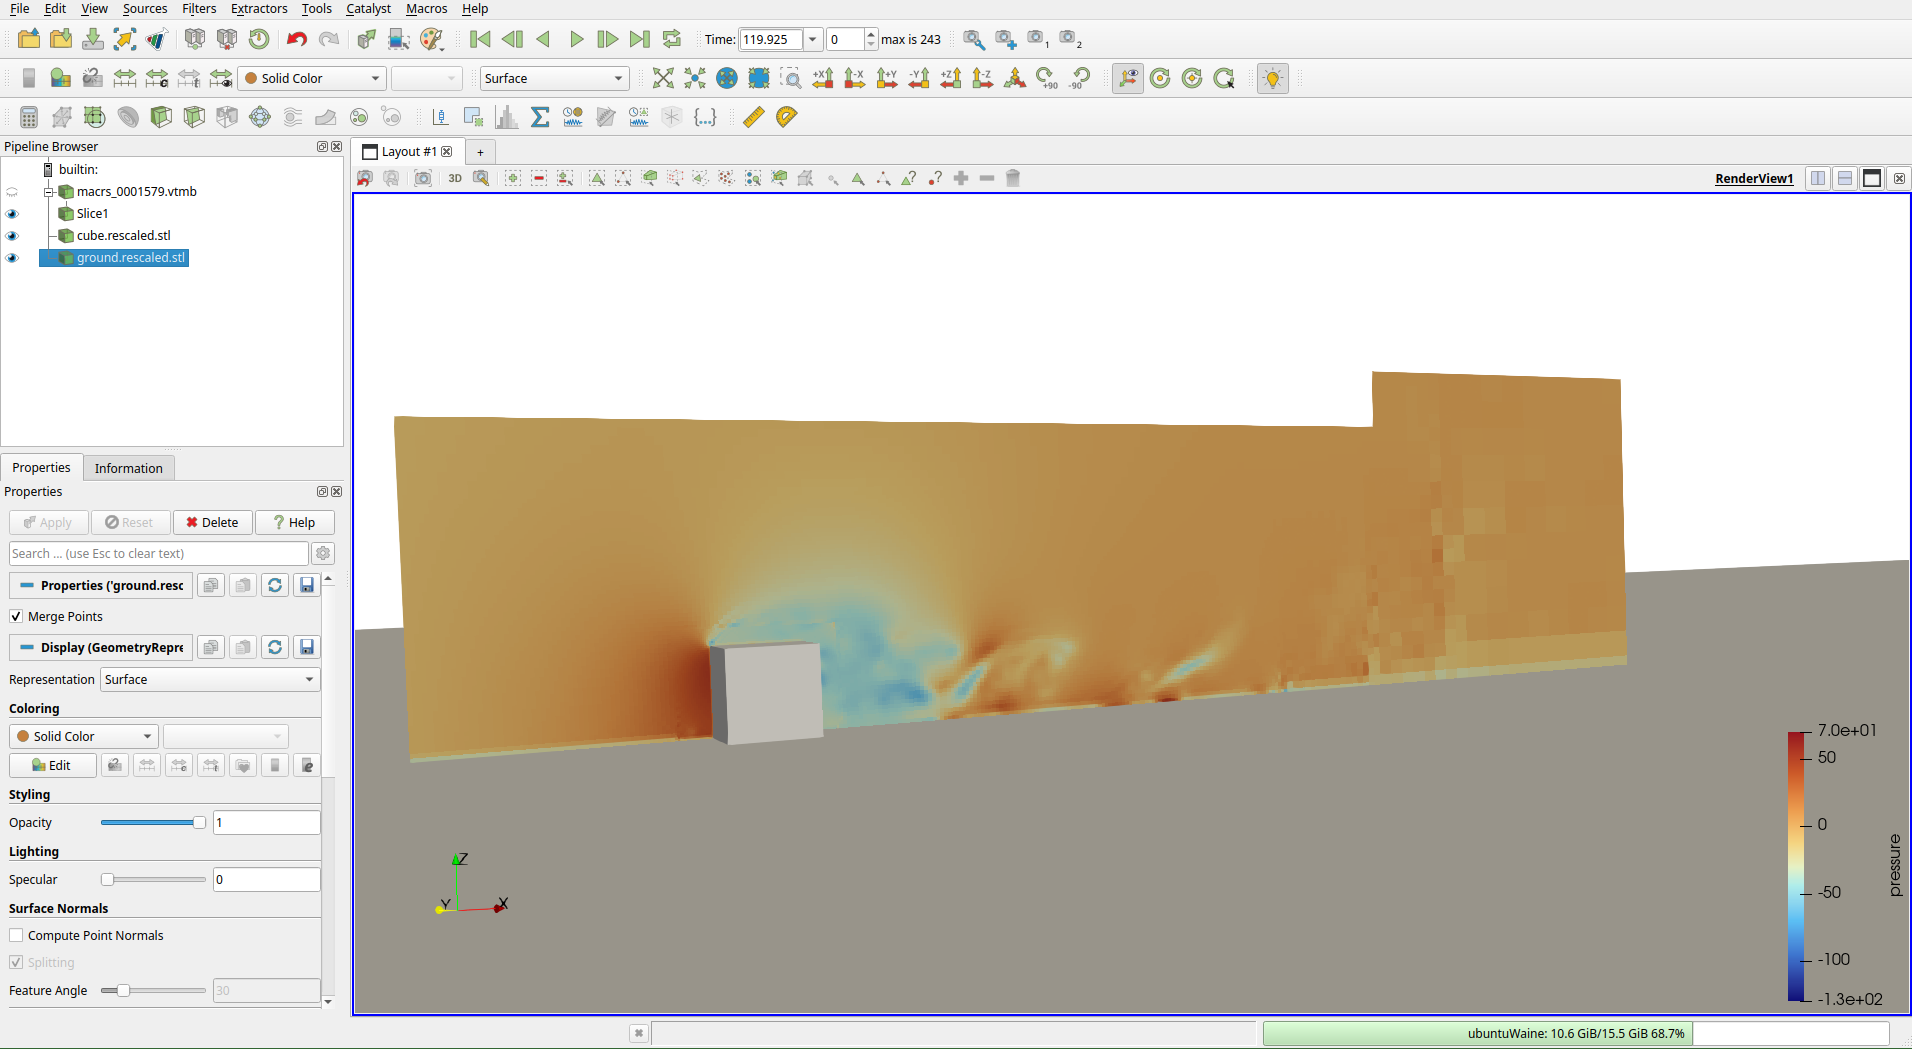
Pressure slice loaded from exported VTK sequence in ParaView.
Set the camera angle and color mapping, and use the same slice and clip filters to compose the view. Then click File -> Save Animation, complete the configuration, and let ParaView render the image sequence. The videos below show the results.
You can also vary the lighting, color palettes, and other view settings to produce different styles.
Domain Statistics
Domain Statistics is a .zip containing VTK files for visualizing time-averaged flow quantities across the domain. Unzip it and open the files directly in ParaView.
Time-averaged \(U_x\) velocity field across the domain.
Time-averaged pressure field across the domain.
Unlike the Full Domain output, these fields are already time-averaged and ready to inspect without any additional filtering.
Cube Pressure
To visualize surface pressure on the cube, download the XDMF and H5 files.
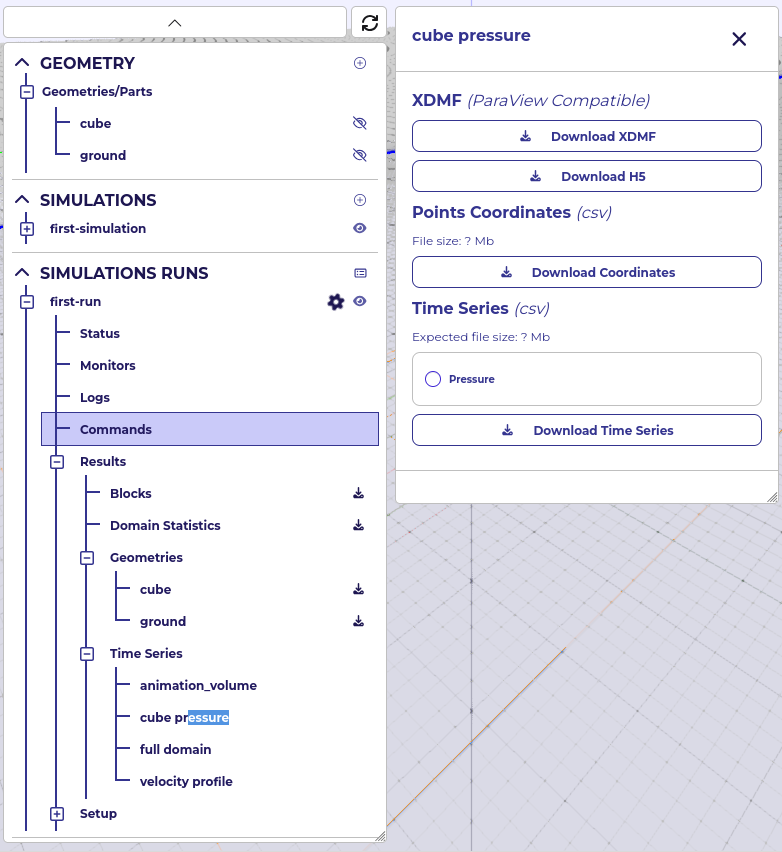
Cube Pressure download form.
Open the XDMF file in ParaView to inspect the full time series of surface pressure on the cube.
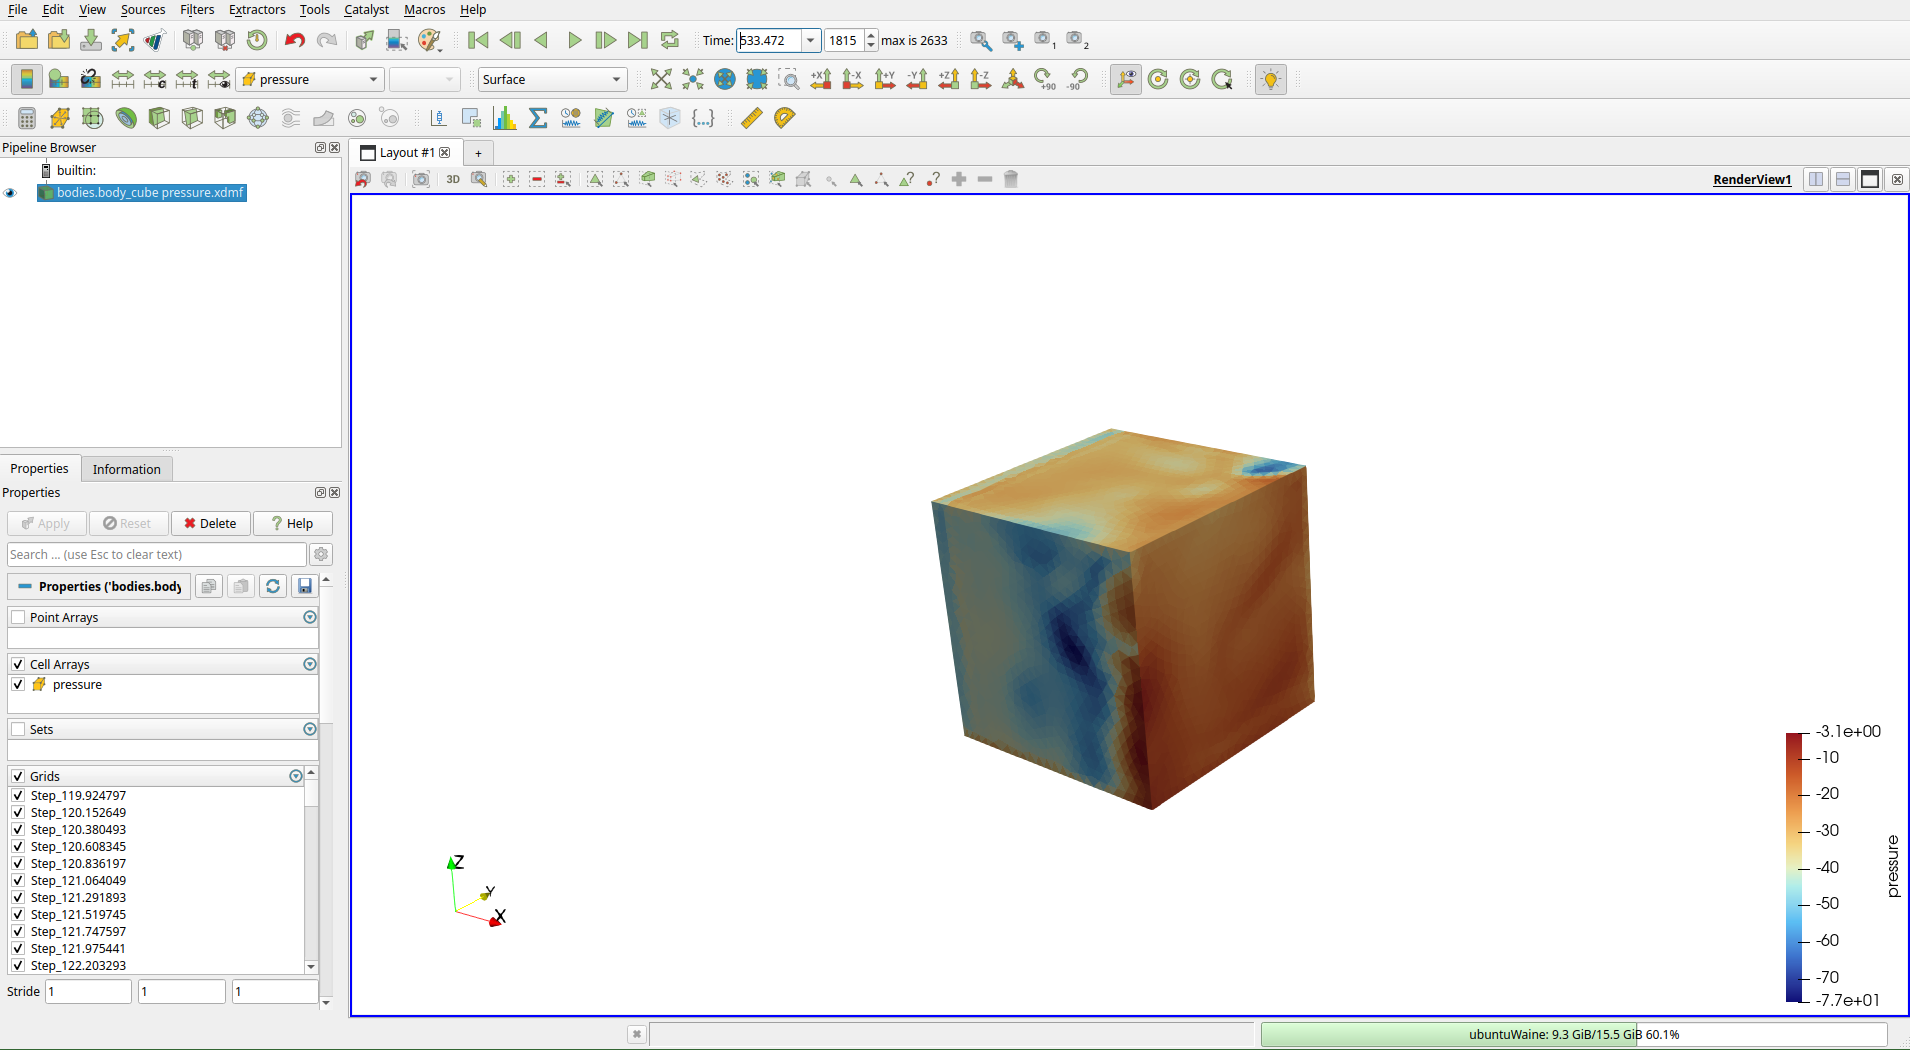
Instantaneous surface pressure on the cube in ParaView.
Apply the Temporal Statistics filter to compute the time-averaged pressure field over the cube.
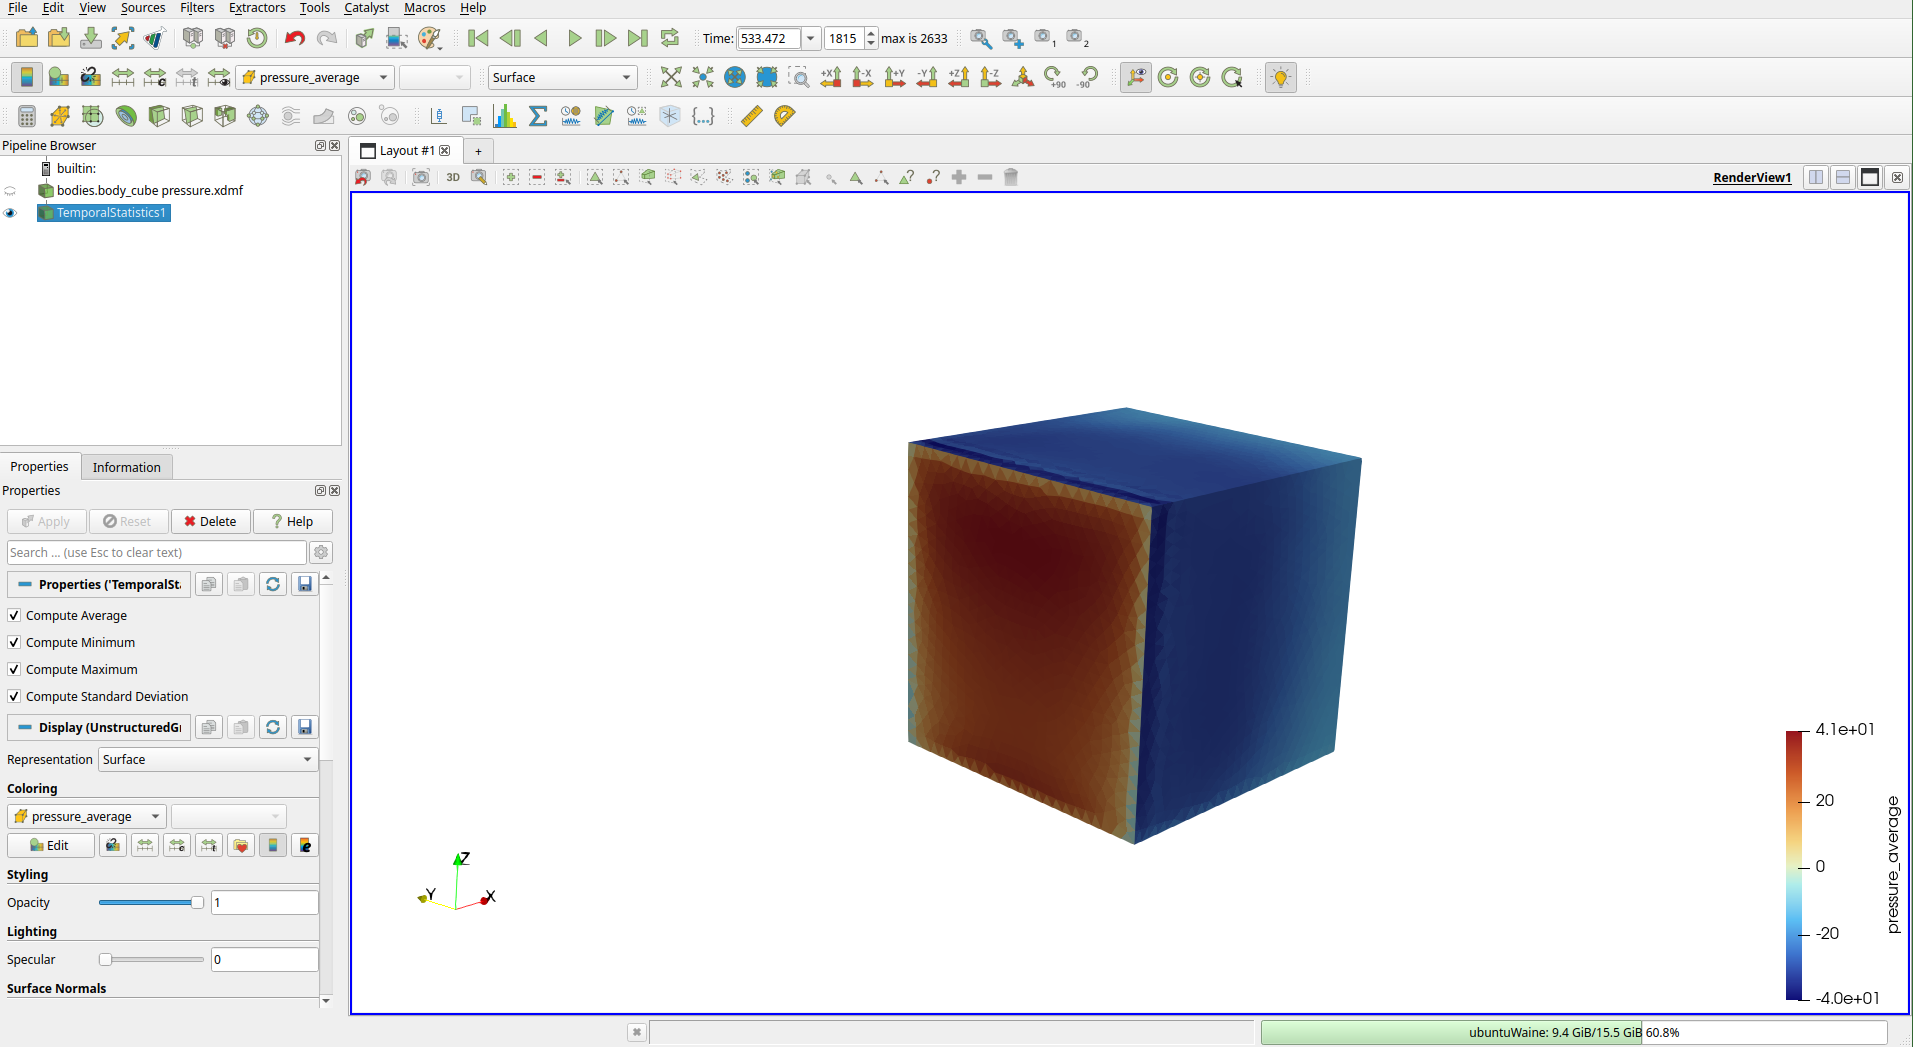
Time-averaged surface pressure after applying the Temporal Statistics filter.
Velocity Profile
For the velocity profile, download the CSV of point coordinates and the time series CSV for \(U_x\).
The points CSV is structured as (idx, x, y, z). The time series CSV has (time_step, id_0, id_1, ...) as the header, with each column containing the velocity values at the corresponding point for each time step.
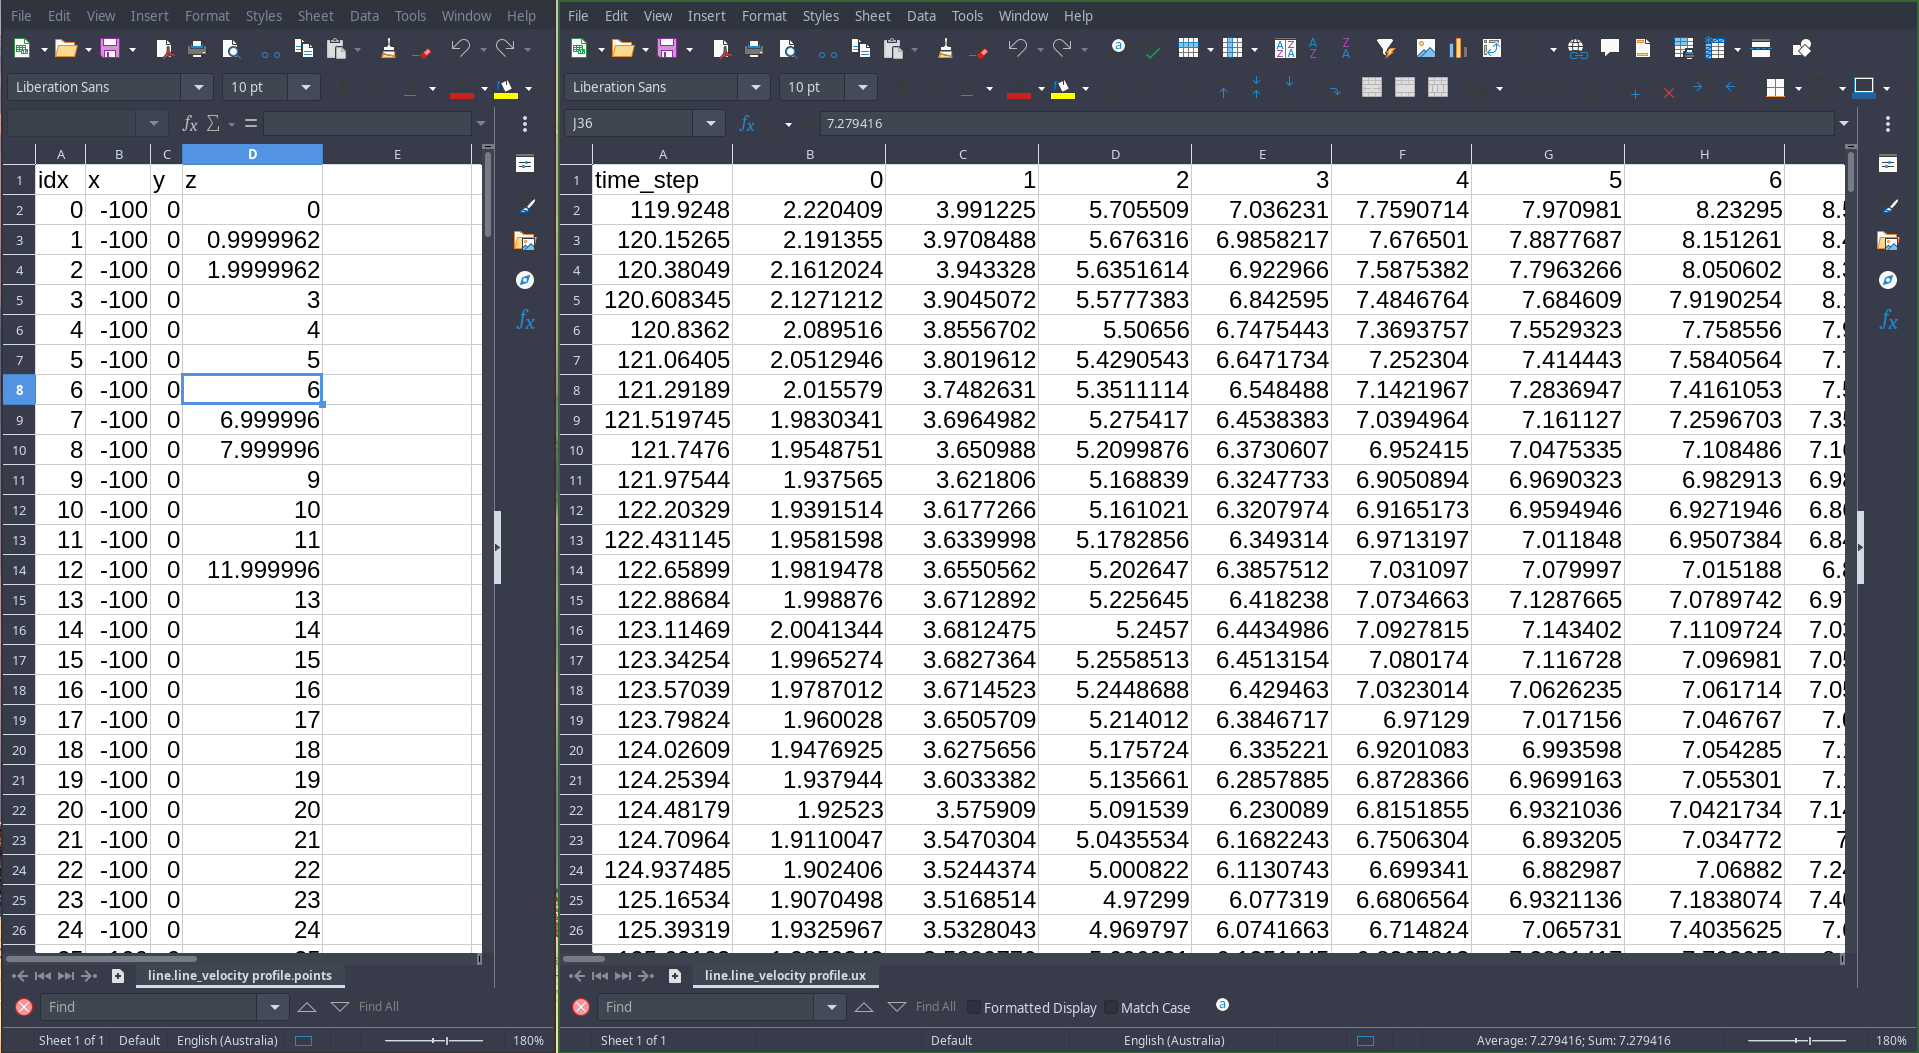
Point coordinates (left) and \(U_x\) time series (right) open in Excel.
Time-average each column and plot \(U_x\) against \(z\) to compare the measured profile against the target.
Other artifacts
Blocks -
.objmesh file representing the simulation mesh. Use it to verify that refinements were applied as expected.Geometries - STL files for all geometries in the simulation. Load them into ParaView alongside the flow results to reproduce the full scene layout.
Note
The Blocks mesh is composed of cubes, each containing 8×8×8 lattice cells.
Next steps
You have completed the getting-started tutorial. The guided cases cover progressively more complex and realistic scenarios:
Atmospheric Boundary Layer (ABL) - set up and calibrate an ABL inflow profile matching a target terrain roughness category
Building Pressure - CAARC - compute mean and peak pressure coefficients on a benchmark high-rise building
Pedestrian Comfort - assess wind comfort at pedestrian level in an urban environment
Topography Factor - evaluate wind speed-up over complex terrain